4,609 people were fatally injured on the job, according to an annual report from the U.S. Bureau of Labor Statistics. That total works out to 3.5 fatal work injuries per every 100,000 full-time equivalent workers. Among the findings in the BLS’ report, violence and other injuries from people and animals accounted for 780 fatalities, or about 17 percent, which includes 458 homicides and 242 suicides. In both those categories, shootings were the most frequent manner of death. Of those 780 fatalities, 37 deaths were either animal or insect related.
The industry with the lowest is education and health services, with .8 per 100,000. In terms of the sheer number of work-related deaths, the industry with the most is transportation and warehousing, with a total of 733. The industry with the least is utilities, with 39 fatal work injuries.
#10 Taxi Drivers & Chauffeurs
- Number of fatal work injuries: 63
Fatal work injury rate (per 100,000 workers): 19.7
#9 Electrical-Power Line Installers and Repairers
- Number of fatal work injuries: 27
Fatal work injury rate (per 100,000 workers): 20.3
#8Drivers/Sales Workers & Truck Drivers
- Number of fatal work injuries: 759
Fatal work injury rate (per 100,000 workers): 24
#7Farmers & Ranchers
- Number of fatal work injuries: 260
Fatal work injury rate (per 100,000 workers): 25.3
#6Structural Iron & Steel Workers
- Number of fatal work injuries: 16
Fatal work injury rate (per 100,000 workers): 26.9
#5Roofers
- Number of fatal work injuries: 56
Fatal work injury rate (per 100,000 workers): 31.8
#4Recyclable Metal Collectors
- Number of fatal work injuries: 34
Fatal work injury rate (per 100,000 workers): 41.2
#3Aircraft Pilots
- Number of fatal work injuries: 72
Fatal work injury rate (per 100,000 workers): 57
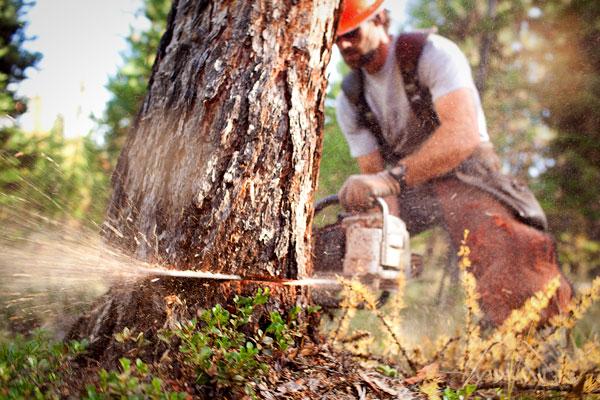
#2 Logging Workers
- Number of fatal work injuries: 64
Fatal work injury rate (per 100,000 workers): 102.4
#1 Fishing Industry Workers
- Number of fatal work injuries: 40
Fatal work injury rate (per 100,000 workers): 121.2
Related Posts:


0 comments:
Post a Comment